Benne BI Dashboard
Summary
I worked with team Benne to create a comprehensive dashboard with them that gave the management a snapshot view of their numbers across verticals like finance, sales, menu, operations and marketing.
Timeline
9 months
My Role
Freelance BI Lead

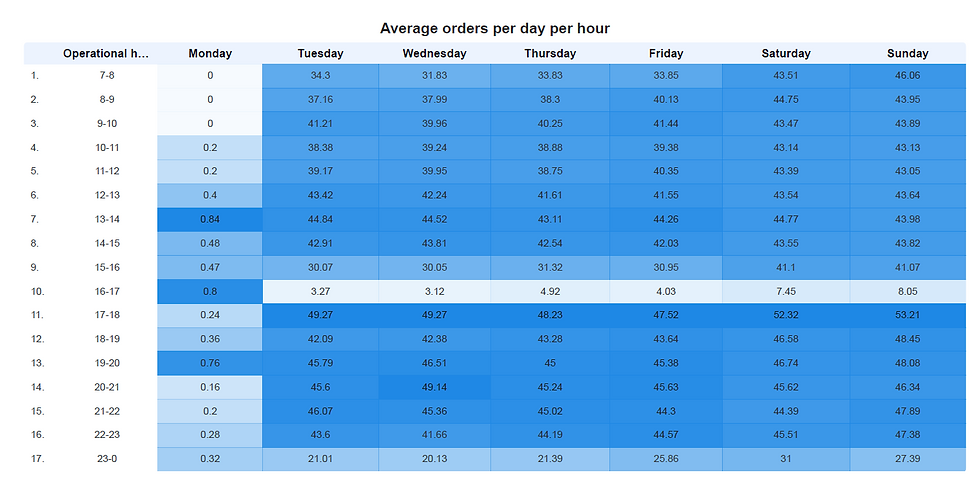
Note: The above pictures are for reference only and contain dummy data, not real company data.
What did it include?
As a part of this project I consolidated data from multiple domains like finance, marketing and operations into a single dashboard. It included:
-
Finance: Revenue MoM & QoQ, Revenue vs Target Revenue, Labour, Marketing, Rent as a % of Revenue.
-
Sales volume: Ranking of Categories by sales volume and Items by sales volume.
-
Orders & Customers: Menu Engineering Matrix, Avg orders per day per hour.
-
Marketing & Loyalty: CSAT, NPS, Social media interactions.
-
Competitors & Products: Competitors Google ratings and prices.
-
Operations: Utility costs, Wastage, Equipment utilization.
Let's talk